? Wave analysis is a way to understand how and why price moves on a chart. It’s like the chart is telling you: “Prices don’t just bounce around randomly – there are patterns (waves), and if you spot them, you can guess what might come next.”
Imagine price doesn’t move in a straight line, but in waves – up and down, up and down.
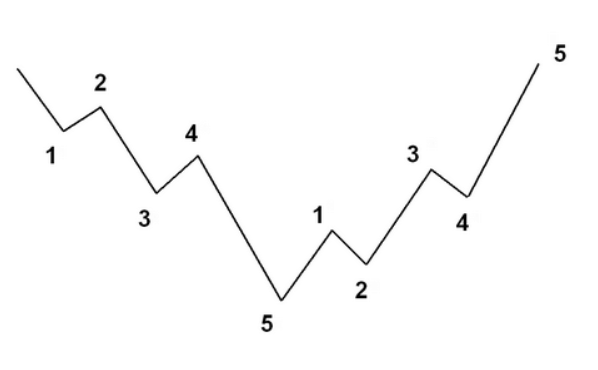
Example:
- Price goes up: 1-2-3-4-5 (5 waves up = trend)
- Then comes a pullback: A-B-C (3 waves down = correction)
That’s a wave cycle. It repeats over and over, just on different scales.
Why should a beginner care?
If you see what wave the price is currently in:
- you can guess whether it’s going up or down next;
- you know when to buy or when it’s better to wait;
- you won’t panic during small drops (it might just be a correction, not a crash).
Simple analogy:
Imagine a crowd of people… One person starts running forward (wave 1). Others join in (wave 3 – the strongest). Then everyone’s running (wave 5). Eventually, the crowd gets tired, and some people turn back (waves A-B-C).
The market works the same way: a crowd of buyers or sellers pushes the price in waves.
Important notes:
- This isn’t magic, just a tool.
- Doesn’t always work perfectly – experience and common sense are key.
- Helps you think ahead instead of chasing price blindly.
To put it simply:
wave analysis is like watching price behavior and trying to guess its “mood” and “next move” based on what it did before.
All content provided on this website (https://wildinwest.com/) -including attachments, links, or referenced materials — is for informative and entertainment purposes only and should not be considered as financial advice. Third-party materials remain the property of their respective owners.