
Large speculators in the futures market have sharply reduced the volume of short positions in Bitcoin and shifted to aggressively increasing bets on growth. According to data cited by MN Trading founder Michaël van de Poppe, referencing analyst Tom McClellan, market participants are now holding a record net long position in the entire observation history. The positioning refers to activity on the Chicago Mercantile Exchange, where institutional players and so-called “smart money” are traditionally concentrated.

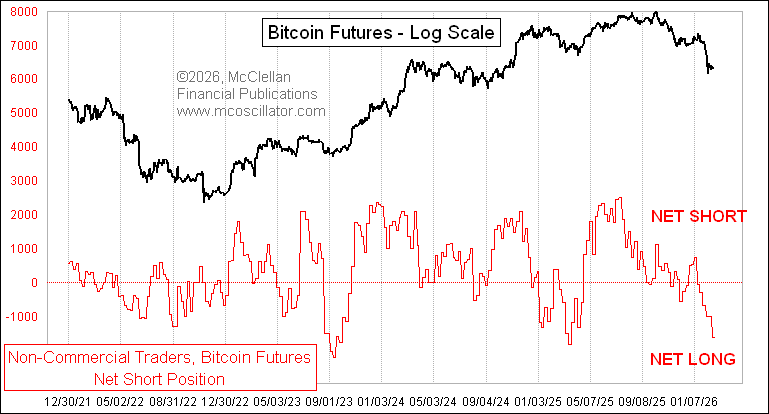
Over the past month, investors changed their net position from +1000 to -1600 contracts. This represents a rapid reversal from a moderately neutral or restrained strategy to a pronounced bullish stance. According to McClellan, the transition occurred with notable urgency, which may indicate expectations of an imminent shift in market dynamics. Historically, such sharp changes in positioning by major players have often preceded large price movements.
Van de Poppe recalled two similar episodes. In 2023, a significant reduction in net short positions preceded a Bitcoin rally of approximately 70%. In 2025, a similar configuration in the derivatives market became the prelude to a 190% rally. In his view, the current structure of positions resembles the final stages of a bear cycle, when large capital begins to carefully but quickly flow into long positions.
The expert believes the current bear market has lasted about 14 months — roughly the same duration as correction phases in the 2013–2015, 2017–2019, and 2021–2022 cycles. As an argument, he points not so much to the dollar chart but to the Bitcoin-to-gold ratio. In his opinion, the BTC/XAU pair better reflects real dynamics, since both assets can be viewed as forms of “hard money,” independent of fiat issuance.
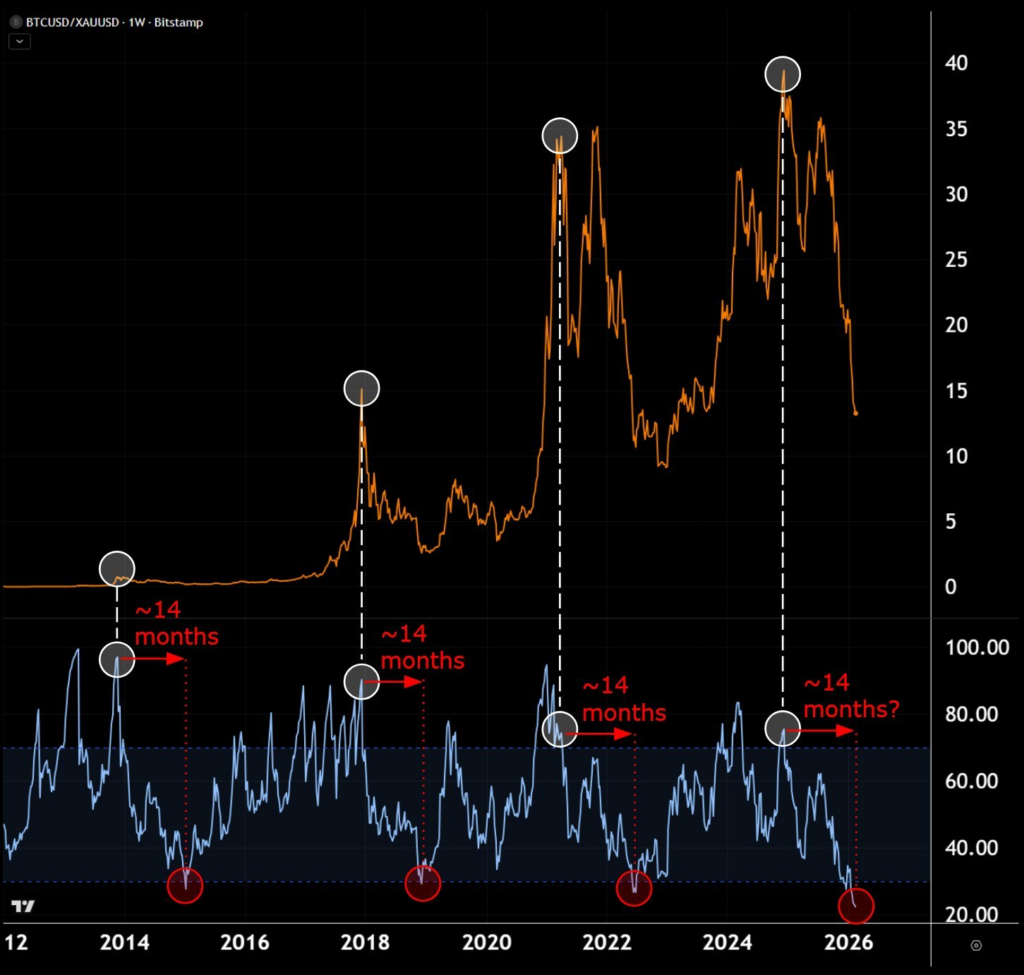
The peak of Bitcoin relative to gold was recorded in December 2024, after which a prolonged decline began. At the same time, the October all-time high around $126,000, according to van de Poppe, may have reflected not so much Bitcoin’s strength as the result of a powerful rally in gold and silver, which also pushed up the dollar valuation of the cryptocurrency. In real terms, when measured in gold, Bitcoin has been in a downtrend for more than a year.
A key argument in favor of a nearby bottom is the weekly RSI for the Bitcoin/gold pair. The indicator has fallen to a historical minimum. Such extreme readings were previously recorded only in the final phases of prior bear cycles, after which years of sustained upward trends followed. In his assessment, the market is likely not at the beginning of a new decline, but in the concluding chapter of the current downturn.
Additional signals are coming from the stablecoin segment. Analyst Ignacio Moreno de Vicente from CryptoQuant noted that the 60-day change in USDT market capitalization has fallen below minus $3 billion for the first time since the end of 2022. The last time such dynamics were observed was during the formation of the cyclical bottom around $16,000, when the market experienced maximum fear, large-scale liquidations and forced deleveraging.
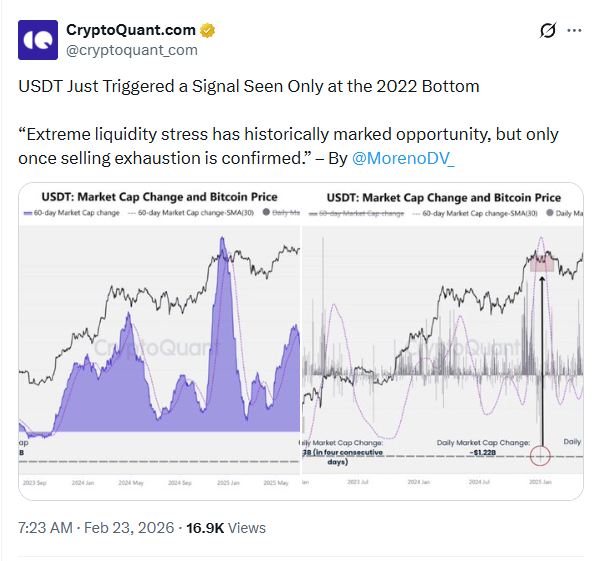
Currently, Bitcoin is trading in the $65,000–70,000 range, and on the daily timeframe three episodes of USDT outflows exceeding $1 billion in a single day have been recorded. Each coincided either with local lows or sharp volatility spikes. According to Moreno de Vicente, mass USDT redemptions reflect the exit of institutional or large holders from the ecosystem. Historically, such processes have more often occurred near the exhaustion of downward momentum rather than at the beginning of a prolonged bear trend.
At the same time, the analyst emphasizes the importance of the liquidity context. In previous cycles, after forced deleveraging ended and stablecoin flows stabilized, Bitcoin transitioned into a confident growth phase. If USDT outflows continue, price pressure may persist. However, if liquidity stabilizes or inflows resume, the risk/reward ratio could quickly shift in favor of buyers.
Interest in the market is also being shown by well-known members of the crypto community. Analysts at Lookonchain noted the return of Erik Voorhees. A year ago, he sold 11,616 ETH for $33.94 million at a price of $2,922. On February 22, he allocated $20.38 million in USDC to repurchase 9,911 ETH at an average price of $2,057. Such moves are often interpreted as a signal that large investors consider current levels attractive for entry.

An additional argument in favor of a possible reversal comes from the Sharpe ratio. The indicator has fallen to minus 38.38. Previously, such low readings were recorded before market reversals in 2015, 2019, and at the end of 2022. Historically, this corresponded to moments when risk had already been realized, and potential returns began to outweigh the perceived danger of further decline.
The combination of factors — record net longs by large speculators, extreme RSI readings in the Bitcoin/gold pair, massive USDT outflows and an abnormally low Sharpe ratio — creates a picture that more closely resembles the end of a bear cycle rather than its beginning. Although volatility and risks remain, market structure is gradually changing. If historical parallels prove relevant, the current phase may become a zone of long-term base formation ahead of a new upward trend.
All content provided on this website (https://wildinwest.com/) -including attachments, links, or referenced materials — is for informative and entertainment purposes only and should not be considered as financial advice. Third-party materials remain the property of their respective owners.