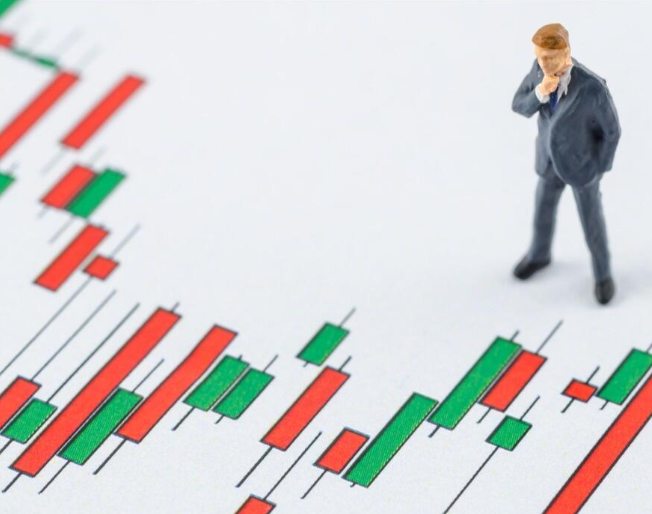
? When a trader opens a chart, a series of green and red bars — candles — appears. Each candle shows how the market behaved during the selected period: day, hour, or minute. The top of the candle represents the highest price, the bottom — the lowest. The body shows where the trading session started and where it ended.
These are Japanese candles, an ancient invention over three hundred years old. Each candle is like a small market diary: where trading started, where it ended, and what happened in between.
In other words, a candle is not just a line on the screen but a short story about market sentiment. A green candle indicates that buyers were stronger, while a red candle signals that sellers prevailed. Sometimes candles have long wicks when the price spikes or drops sharply but quickly returns — reflecting emotions: panic, euphoria, fear of missing out.
Simply put: green candles represent greed, red candles represent fear. It’s as simple as a fairy tale: where there’s fear, there are market lows; where there’s greed, there are highs.
There are also “bars” — another way to display price movement alongside Japanese candles. If candles look like rectangles with wicks, bars are vertical lines with two short ticks on the sides.
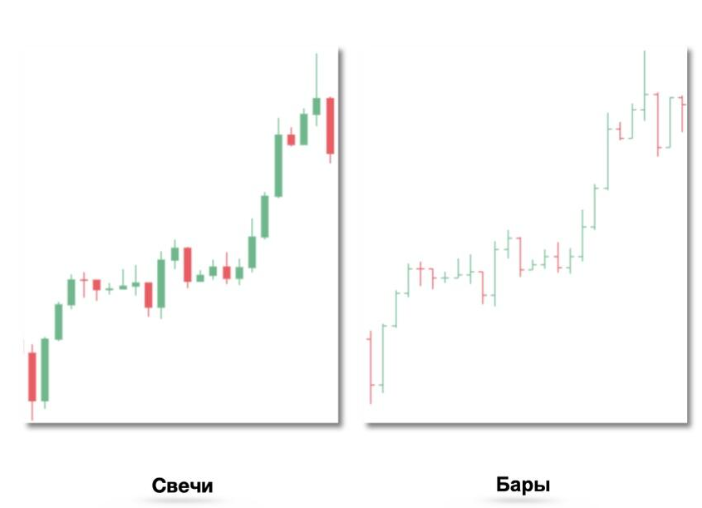
Each bar shows the same information as a candle:
- the top of the line — the high price for the period,
- the bottom — the low,
- small tick on the left — opening price,
- tick on the right — closing price.
It looks a bit “dry” but is informative. Bars are often used by traders who prefer minimalism and don’t want to be distracted by colors or visual effects.
If candles are the “painting” of the market, bars are more like a “blueprint.” They provide the same information without decorative elements.
An investor who sees not just colors but crowd sentiment is already halfway to winning.
Single Patterns
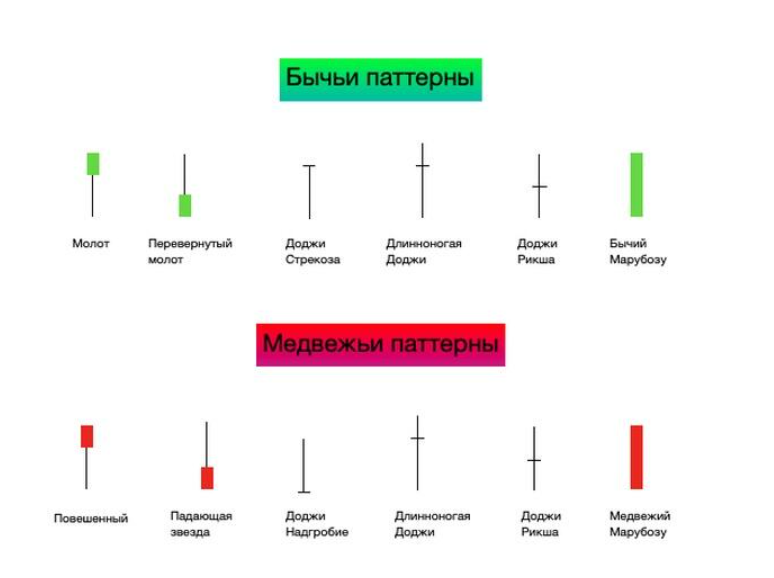
Single candle formations that appear in one trading period help quickly assess the current market state. They show who is dominating — buyers or sellers. Such candles can signal a potential trend reversal or confirm the continuation of the current trend.
Double Patterns
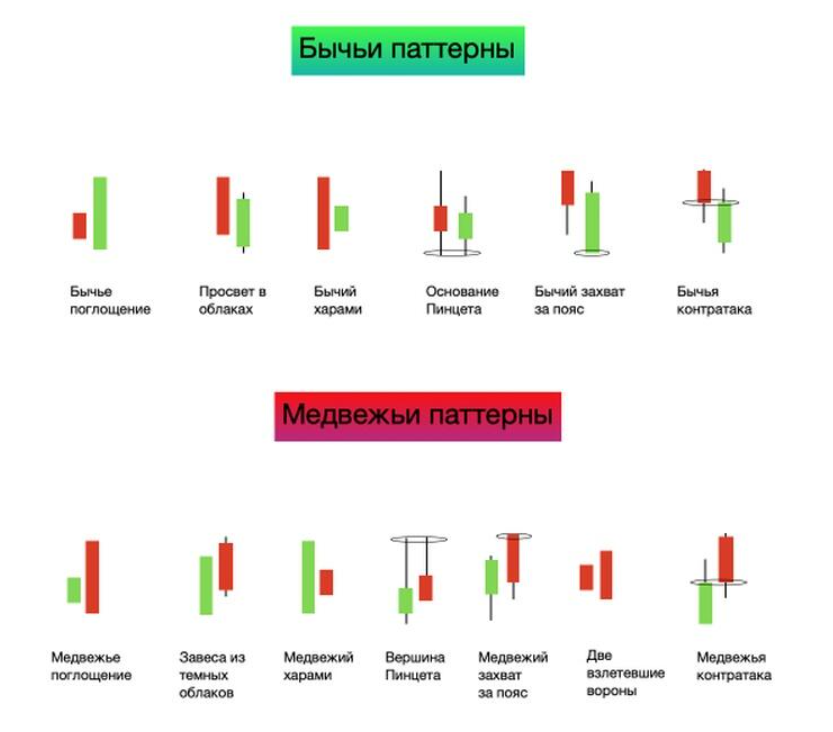
Double candle patterns are an effective chart analysis tool. They help identify possible reversals or trend continuation. These patterns consist of two consecutive candles, and evaluating their accuracy requires careful attention to the current market situation.
Triple Patterns
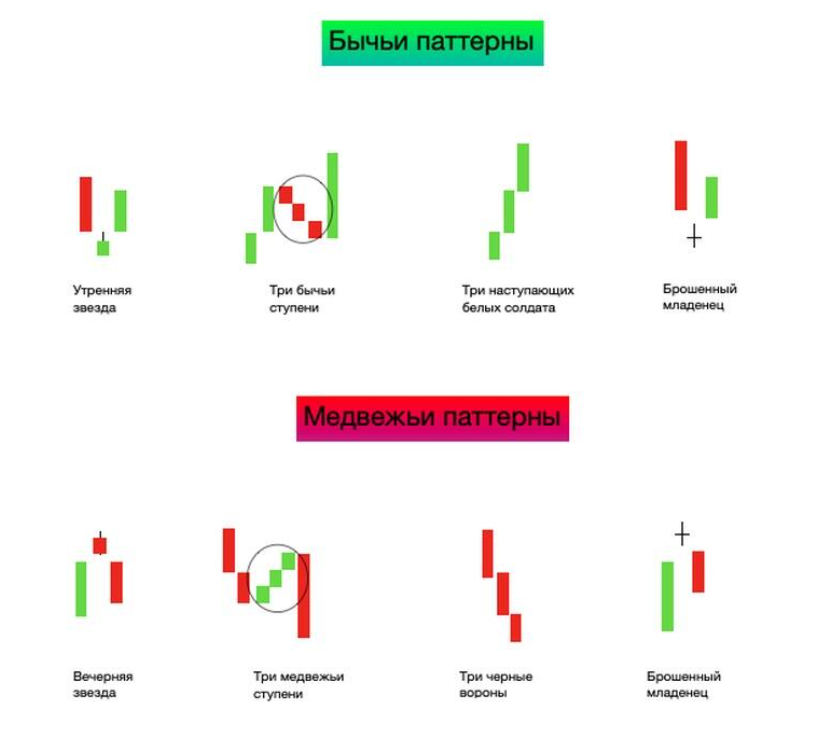
Triple candle patterns indicate a potential trend reversal or continuation. Analyzing them requires careful assessment of market conditions. Proper understanding of these patterns helps make effective decisions for profitable trading.
Why It’s Important to Hold Coins for the Entire Cycle
The cryptocurrency market moves in cycles. The core of these cycles is the halving — an event that occurs every four years when the reward for miners for finding a block is halved. At this point, the supply of new coins decreases, and with stable demand, the price gradually rises.
Historically, each halving led to a new growth phase for Bitcoin — and, after inevitable corrections, established a new level for the next cycle. But most investors make the same mistake: they exit too early, not waiting for the full cycle to complete.
Patience vs Panic
When the market falls, red candles get longer, and news feeds get louder. At these times, it’s important to remember that this is not a crash but part of the market’s natural rhythm. Each cycle includes growth, overheating, and cooling. Those who can endure the “winter” are rewarded with a “spring” of profit.
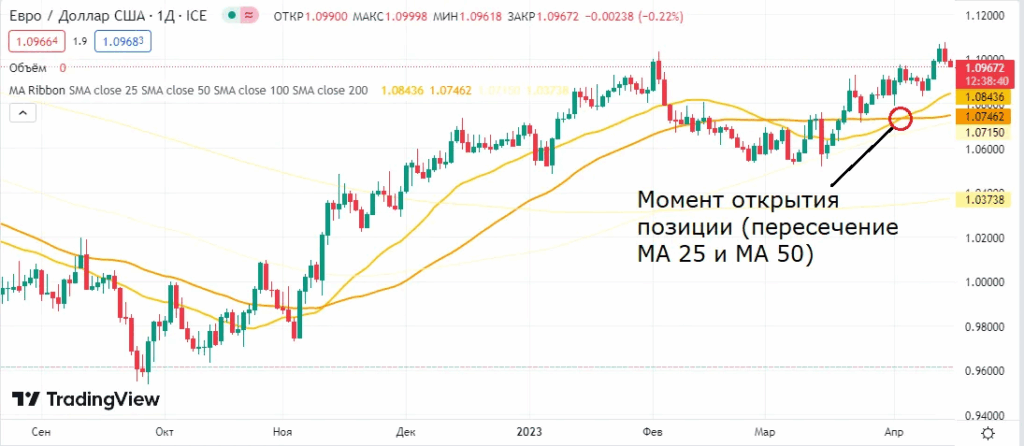
Patience Before Entering a Trade
Before opening a position, a trader analyzes the market and looks for a potential signal. For example, a signal may occur when the 25-day and 50-day moving averages cross. In this case, the trader monitors the crossover and opens the trade after confirmation.
Patience When Exiting a Trade
Assessing the exit point requires patience. After opening a position, the price may move sideways for some time, i.e., remain in a flat range. During this period, the trade does not generate profit, and the trader may be tempted to exit prematurely.
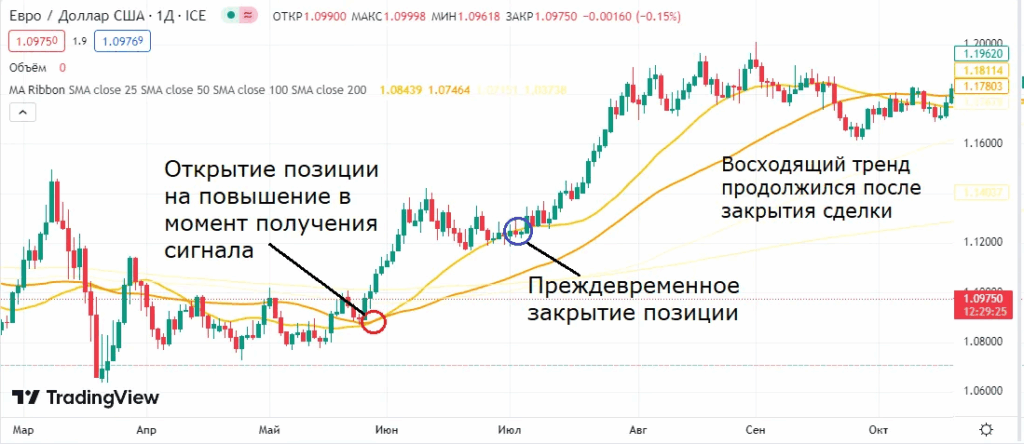
Another example: the position moves in the desired direction, and the trade is already in profit. Instead of waiting for further growth and maximum profit, the trader loses patience and closes the trade. As a result, there is profit, but it does not reach the potential maximum planned by the strategy.
It’s understandable that some find holding coins boring. Checking the chart every ten minutes for tiny fluctuations is more exciting. But history shows that the most profitable trades are those not closed prematurely.
? The market rewards not the smartest or the fastest, but the most patient, and each new cycle punishes the impatient. Panic, red candles, loud headlines — all part of the show. Those who stay on stage until the finale are ultimately applauded standing.
All content provided on this website (https://wildinwest.com/) -including attachments, links, or referenced materials — is for informative and entertainment purposes only and should not be considered as financial advice. Third-party materials remain the property of their respective owners.