
? Most investors and traders are used to relying on standard metrics: inflation, interest rates, or indices like the S&P 500 and NASDAQ. However, sometimes “non-standard” tools outperform traditional indicators, especially when markets become unpredictable. Here are four such indicators increasingly used by experienced market participants.
TGA Balance (Treasury General Account)
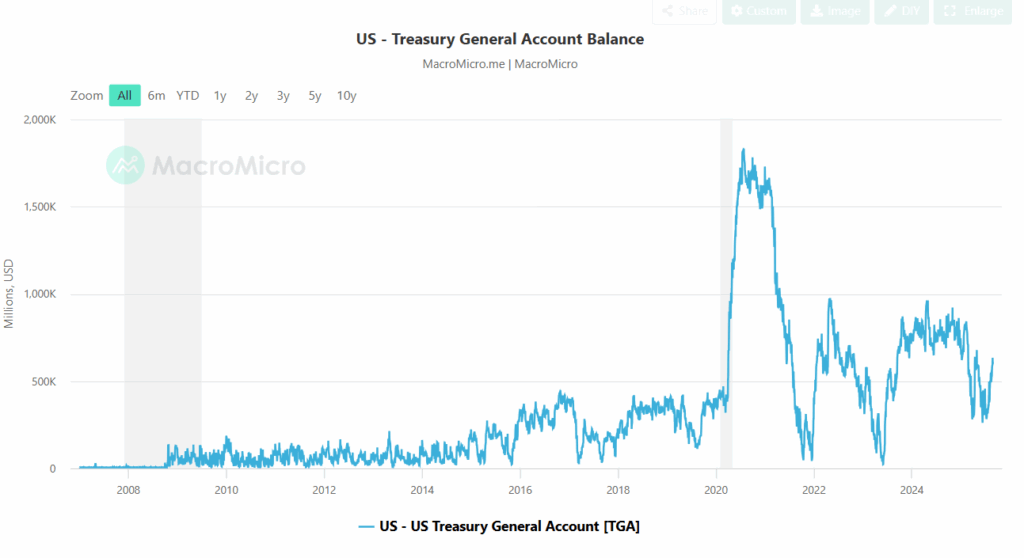
The U.S. Treasury maintains its account at the Federal Reserve. Its balance directly affects liquidity in the financial system. When the TGA decreases, money is effectively “released” into the market, increasing liquidity. Conversely, an increasing balance withdraws capital and can cool investor appetite. Monitoring this metric is particularly important when the Fed balances between tight and loose monetary policy.
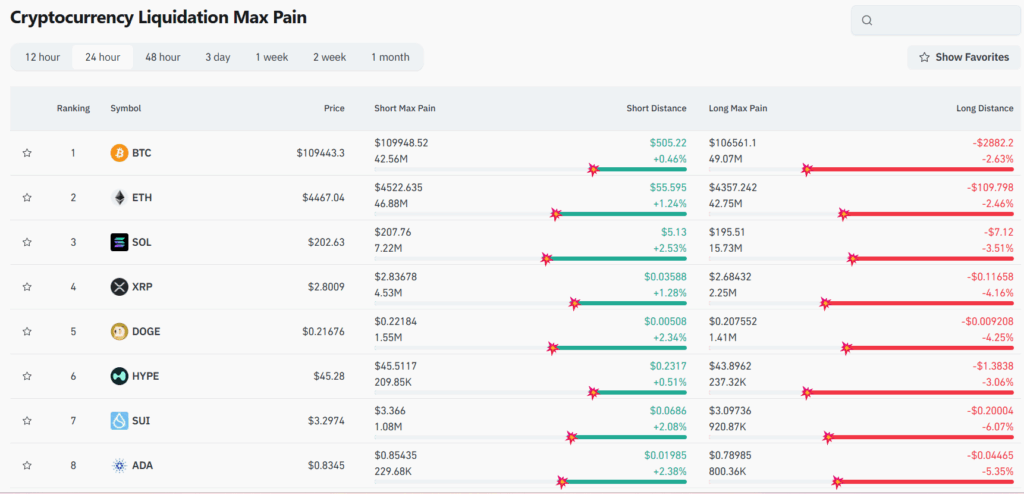
The cryptocurrency market is known for large movements often linked to leveraged trader liquidations. The Liquidation Max Pain indicator shows the price levels where the most positions are likely to be liquidated. Prices often gravitate toward these levels, as the market seeks to “flush out” the maximum number of participants. For active traders, this is valuable information for identifying where to be cautious and where potential reversals may occur.
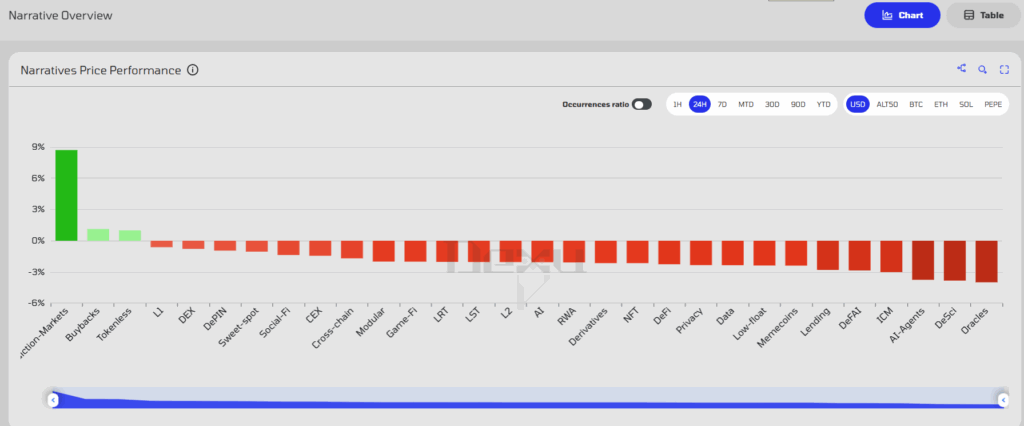
Crypto trends emerge and fade faster than in traditional sectors. Narrative Performance is a tool that helps identify which narratives in the crypto ecosystem are gaining traction. Today it might be AI and decentralized computing, tomorrow tokenized assets or blockchain-based social apps. Analyzing the “strength” of these trends helps track liquidity flows and spot promising altcoins before they “take off.”
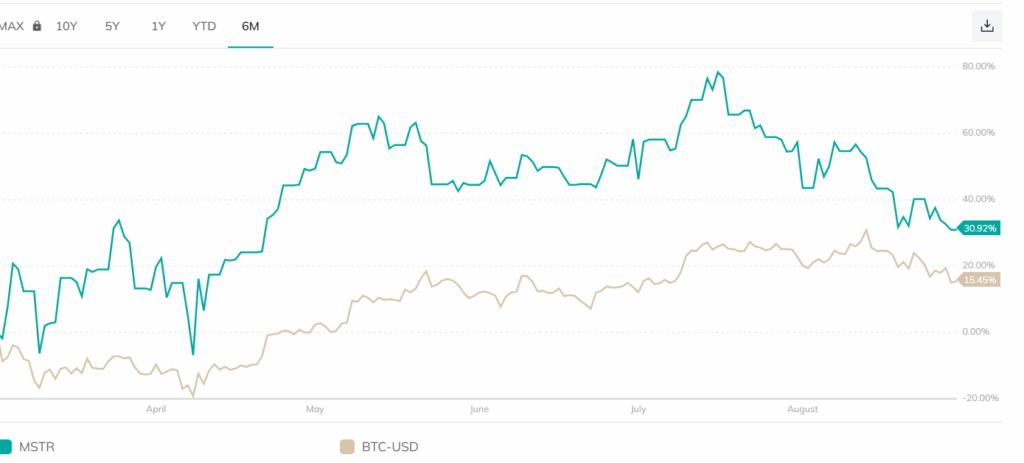
MicroStrategy (ticker: MSTR) has long served as a public proxy for Bitcoin. Its stock often moves ahead of BTC itself, as the market views it as a “speculative bet” on cryptocurrency. The ratio of MSTR stock movement to BTC provides a clue: if the company’s shares surge, Bitcoin may follow. This indicator is particularly useful for those seeking early signals before major price moves.
? Conclusion
These indicators are rarely found in economics textbooks, yet they provide a live view of market dynamics. In times of uncertainty, when classic metrics lag, these tools help reveal underlying processes and prepare for sharp market movements.
All content provided on this website (https://wildinwest.com/) -including attachments, links, or referenced materials — is for informative and entertainment purposes only and should not be considered as financial advice. Third-party materials remain the property of their respective owners.