
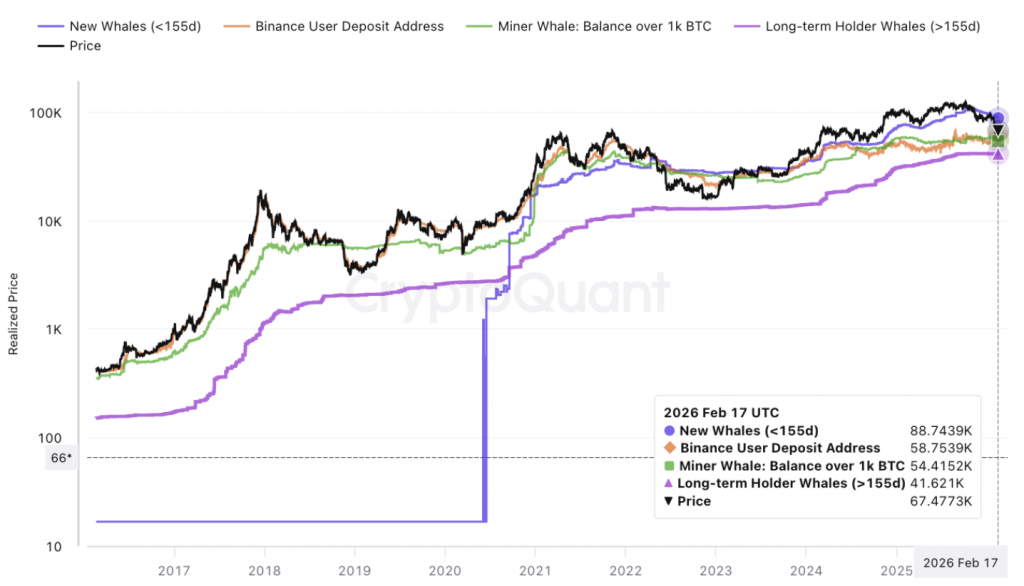
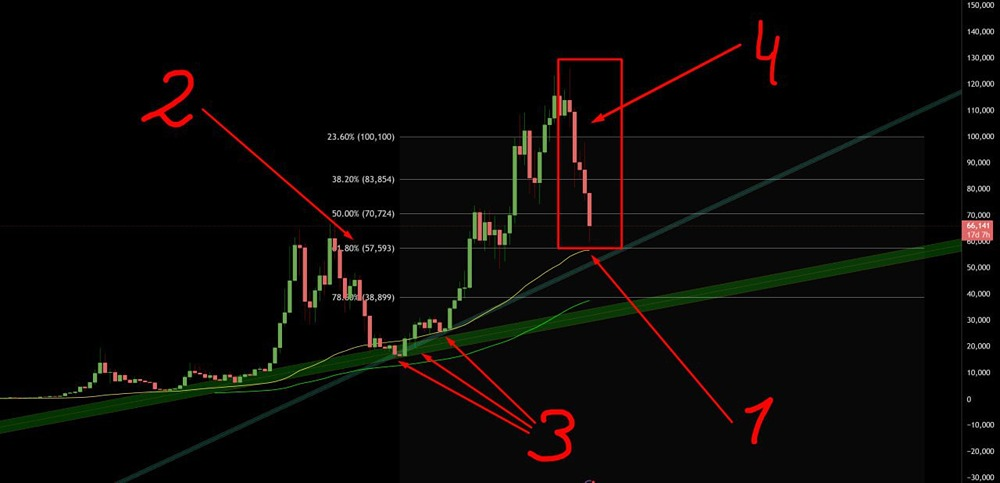
An analyst at the CryptoQuant platform, Burak Kesmeci, published a detailed breakdown of the current market structure in which he identified four key realized price levels — a kind of reference points by which the depth of a possible correction can be assessed. His central conclusion sounds firm: after bitcoin lost the realized price level of new large holders at $88,700, the market effectively entered a classic bearish cycle phase.

What Is Realized Price and Why It Matters
Realized price is the average acquisition cost of coins for a specific group of participants. Unlike the spot price, which reflects the current balance of supply and demand, the realized price shows the “cost basis” of the asset for holders. When coins move on the blockchain, their realized price is updated to the transaction value.
If a large volume of coins was purchased at roughly one level, that range becomes a zone of position concentration. In a bullish cycle, such zones act as support — participants are in no hurry to sell below their cost basis. In a bearish cycle, they can turn into pressure zones when investors lock in losses.
It is through this lens that Kesmeci proposes viewing the current market structure.
The First Stop Is Already Behind: $88,700
The $88,700 level corresponded to the realized price of new large holders — the so-called “new whales” who accumulated significant volumes during the recent growth cycle.
The loss of this level means that a significant portion of fresh capital has moved into unrealized loss. Historically, this is an important turning point: when new large participants begin to experience pressure, the market shifts from a phase of confidence to a phase of doubt.
According to the analyst’s observations, in previous cycles the loss of this zone was almost always accompanied by further movement toward a deeper cost structure of the network.
$58,700 — The Nearest Point of Attraction
Between current levels and the overall realized price of the entire network lies an intermediate zone — the realized price of deposit addresses on the Binance exchange at $58,700.
This is an important nuance. Deposit addresses reflect coins that have already been moved to the exchange, meaning they are potentially ready for sale. Their average cost basis is the level where real sellers are concentrated.
Kesmeci emphasizes that historically, after losing the level of new whales, bitcoin at least tested the overall realized price of the network. And the only intermediate support before that is precisely $58,700. If pressure persists, the market is highly likely to gravitate toward this range as the next test zone.
$54,700 — The Overall Realized Price of the Network
This level reflects the average purchase price of all coins in circulation. Simply put, it is the “average temperature in the hospital” for the entire market.
In previous cycles, this zone often became a key equilibrium point. Testing the overall realized price means that a significant portion of participants is on the verge of loss. This increases emotional tension and creates conditions for the capitulation of weak hands.
However, testing this level by itself does not guarantee an immediate reversal. History shows that the market can consolidate below or around it for an extended period.
$41,600 — The Deep Reference Point of Old Whales
The lowest of the four levels is the realized price of old large holders at $41,600. This group is distinguished by historically demonstrating the greatest resilience. If the price approaches their average cost basis, the market is in a state of deep revaluation.
Such a scenario implies not just a correction, but a phase of large-scale capital redistribution. In previous cycles, approaching the realized price of long-term large holders coincided with the final stages of the bear market.
Realized Losses: Alarming Signals
Data from CryptoQuant record a noticeable deterioration in the supply structure. The share of coins in unrealized loss has reached 46% — the highest level since the end of 2022.
Another platform analyst, Darkfost, noted that on February 5 realized losses exceeded 30,000 BTC per day. For comparison, during the peak of the previous bear market daily peaks reached 92,000 and 80,000 BTC.

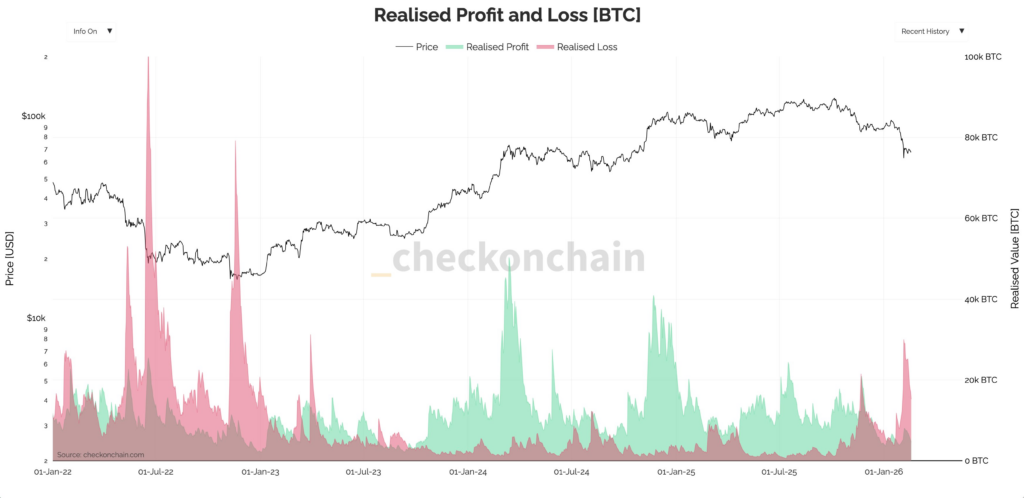
This allows us to speak of signs of capitulation — but in a more moderate form than in 2022. Panic selling is intensifying, but its scale is still significantly below historical extremes.
After rebounding from a 15-month low below $60,000, pressure partially eased, but on-chain metrics still point to the structural vulnerability of the market.
AI’s View: Where Is the Bottom Formed — On-Chain or in Macroeconomics?
From the perspective of machine analysis of historical data, the “roadmap” through realized price levels has statistical justification. In 2022, the peak of realized losses preceded the actual market bottom by about five months. In other words, capitulation is a process, not a point.
The current 30,000 BTC of daily realized losses look significant, but are still three times lower than the peak values of the previous cycle. This may indicate either a milder phase of decline or that the final stage is still ahead.
An additional factor is macroeconomics. In 2022, the pressure was largely industry-driven: the collapse of infrastructure players, deleveraging, a chain of bankruptcies. Today’s dynamics are more related to tight monetary policy and global investor caution.
This fundamentally changes the logic of searching for the bottom. The question is no longer where the next internal ecosystem failure will occur, but when the external environment will change — inflation expectations, rates, liquidity. And here a key uncertainty arises: can realized price levels serve as a reliable support in a cycle where the main driver lies outside the blockchain?
The four marks — $88,700, $58,700, $54,700, and $41,600 — form a clear structural map. But the market bottom, as history shows, is determined not only by a number on the chart, but by a combination of time, capitulation, and changes in macro conditions.
All content provided on this website (https://wildinwest.com/) -including attachments, links, or referenced materials — is for informative and entertainment purposes only and should not be considered as financial advice. Third-party materials remain the property of their respective owners.