
? Over the past two years, large Bitcoin holders, known as “whales,” have sold 115,000 BTC. According to analysts, this represents the largest sell-off since mid-2022. In the last month alone, the volume of sold coins reached approximately $12.7 billion, putting significant pressure on the cryptocurrency’s price.
Scale of the sell-off and market impact
CryptoQuant analyst Caueconomy notes that whale reserve declines are accelerating and have reached peak levels in 2025. In 30 days, the balances of the largest players fell by more than 100,000 BTC — indicating increased risk aversion among long-term investors.
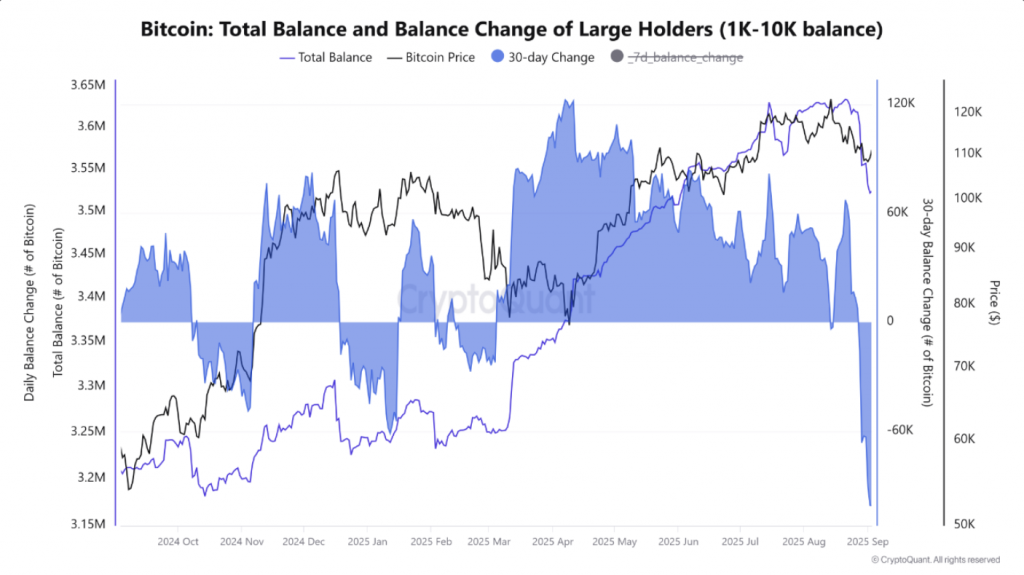
Change in Bitcoin balances of major holders. Source: CryptoQuant
Such massive redistribution of coins immediately affected the market: sales became a significant factor, pushing prices below the psychologically important $108,000 level. According to CryptoQuant, this level of whale pressure hasn’t been seen since July 2022. In total, 114,920 BTC worth $12.7 billion left their wallets in one month.
Short-term fluctuations and signs of slowdown
Seven-day changes in whale balances reached their highest level since March 2021 — on September 3, they moved more than 95,000 BTC in one week. This activity caused short-term turbulence and increased market liquidations.
However, aggressive selling is gradually declining: as of September 6, the weekly reduction was around 38,000 BTC. This indicates that the pressure from whales may be easing.
Well-known Bitcoin entrepreneur David Bailey recently stated that BTC prices could rise to $150,000 if the two largest whales stop selling.

Institutional counterbalance
Despite aggressive whale activity, institutional players are taking the opposite approach — accumulation. Funds and companies are increasing purchases, and interest in Bitcoin through ETFs continues to grow.
This balance of forces creates structural market resilience: while whale actions limit short-term growth, fundamental demand remains strong.
Long-term outlook remains positive
Analysts emphasize that Bitcoin looks resilient in the broader picture. The correction since mid-August has been only 13% from the all-time high, much less than previous declines.
According to analyst Dave the wave, Bitcoin’s one-year moving average is currently around $94,000 and will cross $100,000 next month.
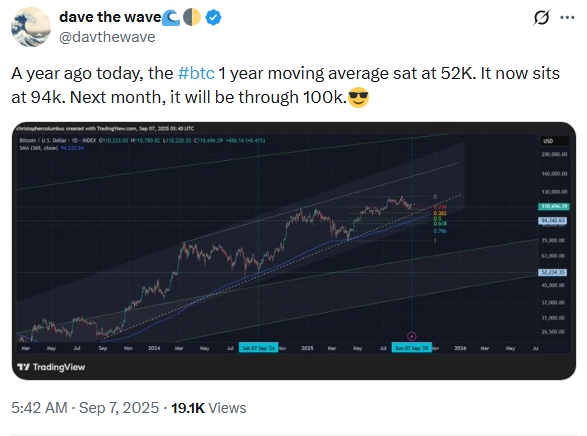
1-day Bitcoin chart and annual moving average. Analysis: Dave the wave
In technical analysis, this indicator is considered an important long-term support level. Its steady growth signals the continuation of the upward trend even amid local fluctuations.
? Conclusion: who will win — whales or institutions?
The Bitcoin market is once again in a phase of confrontation: on one side, whales are massively selling assets; on the other, institutional investors are ready to buy coins. In the coming weeks, this balance will be the key factor.
If large-player sales continue, BTC may remain under pressure. But if institutional demand via ETFs and corporate purchases persists, Bitcoin has a good chance not only to maintain its position but also to reach new all-time highs in the long term.
All content provided on this website (https://wildinwest.com/) -including attachments, links, or referenced materials — is for informative and entertainment purposes only and should not be considered as financial advice. Third-party materials remain the property of their respective owners.