
On February 25, according to data from Bitstamp, Bitcoin posted a solid 6.2% gain. The daily candle closed above the psychologically important $70,000 level — despite comments from U.S. trade representative Jamieson Greer about a possible increase in tariffs on Chinese goods from 10% to 15% “in the coming days.” In an interview with Bloomberg, he clarified that the current rate remains at 10% for now, but an order is being prepared to raise it to 15% “where appropriate.”
Just a few months ago, such rhetoric would likely have intensified pressure on risk assets, including cryptocurrencies. However, the current market reaction suggests a noticeable decline in sensitivity to trade tensions. Bitcoin not only avoided a pullback but strengthened, demonstrating relative resilience to external headwinds.
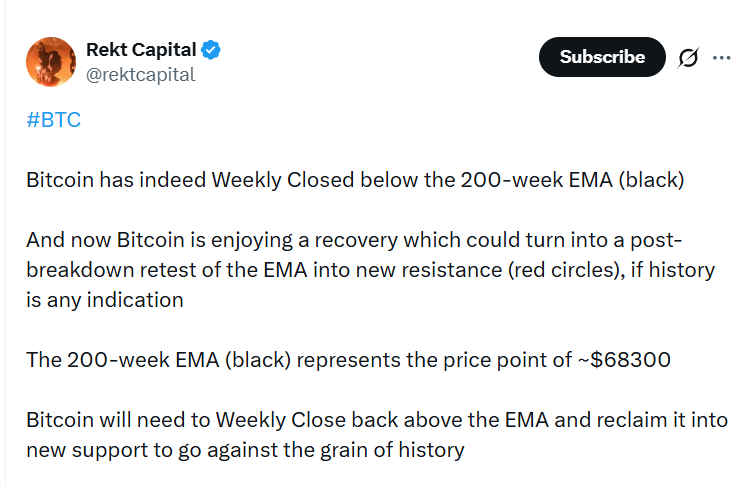
200-Week EMA: The Level That Could Decide the Trend
After prolonged selling pressure, the BTC/USD pair has returned to the 200-week exponential moving average (EMA), currently around $68,355. Historically, losing this level as support has coincided with extended bear markets, while reclaiming it has aligned with long-term bottoms.
Another trader, Castillo Trading, is more optimistic. In his view, if current support holds, the next target lies around $74,492 — corresponding to the 2025 low. Posting on X, he described the move as a “good start to a rebound,” with the yearly low zone serving as the first key area for reassessment.

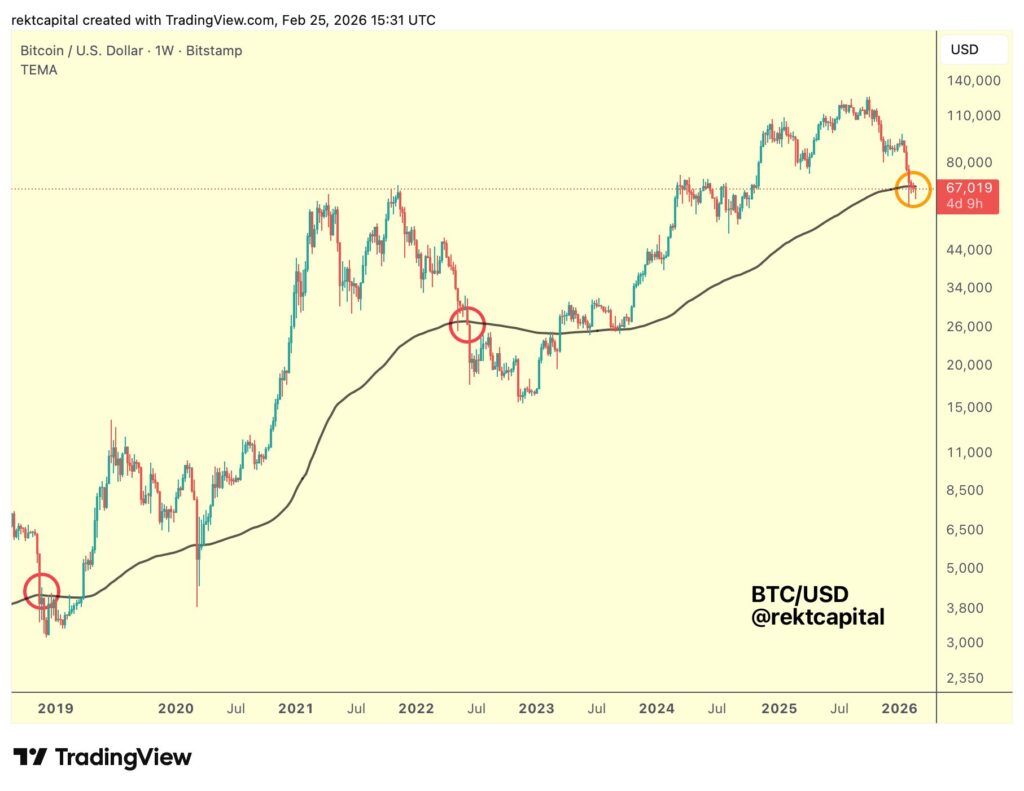
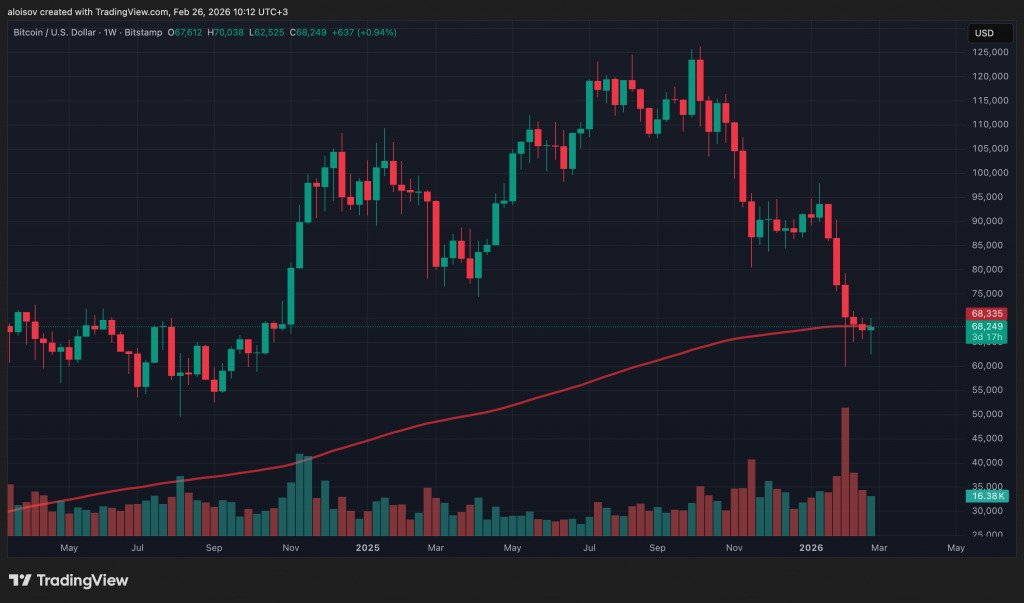
1-week BTC/USD chart and 200 EMA. Source: Bitstamp
Crypto analyst Rekt Capital reiterated his stance first voiced in February: the key factor will be a weekly close above the 200-week EMA. Without it, the recovery could prove to be a technical bounce rather than a full trend reversal.

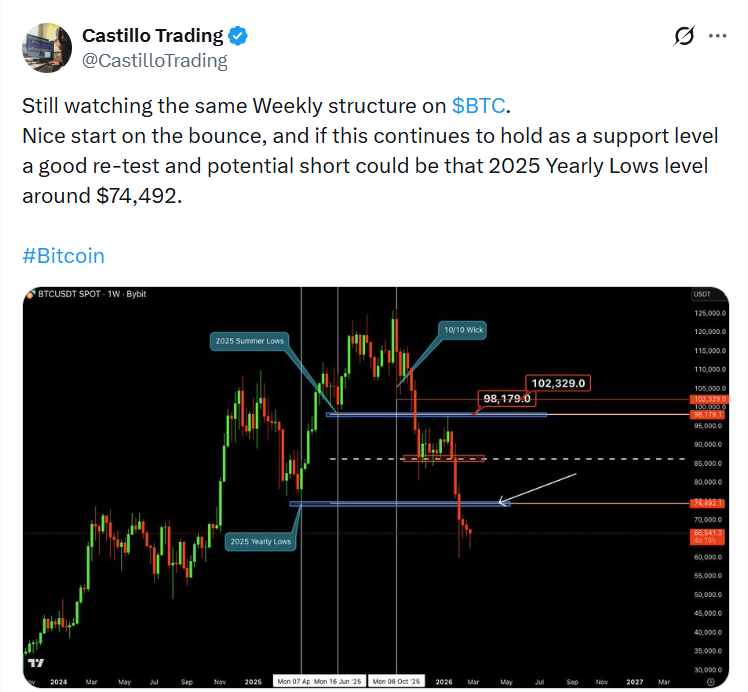
1-week BTC/USD chart. Analysis: Castillo Trading
Bullish Divergence Against Gold
An interesting signal is also emerging on an intermarket basis. Gold is trading above $5,000 per ounce, yet analyst Michaël van de Poppe pointed to a potential bullish divergence in the Relative Strength Index (RSI) on the daily BTC/GOLD chart. While not yet fully confirmed, he noted that Bitcoin’s recent strength could indicate the beginning of capital rotation.

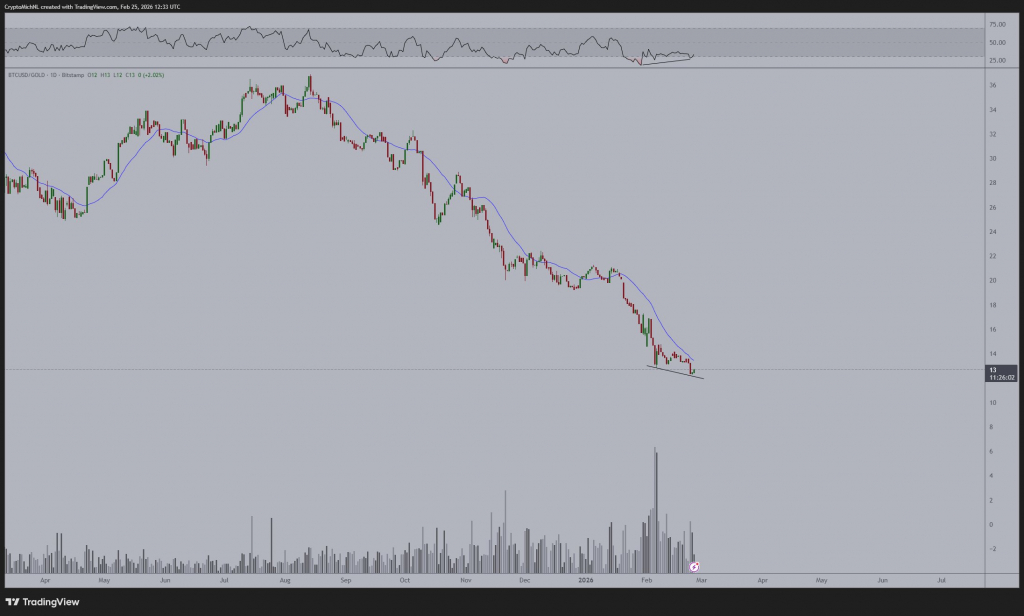
1-week BTCUSD/GOLD chart. Analysis: Michaël van de Poppe
If capital flows begin shifting from gold into crypto, this would challenge the narrative that dominated earlier in the year — that Bitcoin had lost its “digital gold” status and become purely a high-risk asset. Following the decline from the October 2025 peak, many analysts observed BTC’s growing correlation with equity indices rather than traditional safe-haven instruments.
Historical Context and Algorithmic Analysis
From a statistical perspective, Bitcoin’s interaction with the 200-week EMA has rarely been smooth. According to data from KuCoin, in previous cycles reclaiming this average took between 8 and 30 weeks and almost never occurred on the first attempt without a subsequent retest from below. This means that even a strong daily close above the level does not guarantee its consolidation as long-term support.

Algorithmic analysis of past market structures suggests that a sustainable bullish scenario forms only after confirmation on both weekly and monthly timeframes. Until then, the risk of a false breakout or a renewed test of the $66,000–68,000 range remains.
The Key Focus in the Coming Days
Attention is now centered on the weekly candle close. The $68,355 level effectively marks the boundary between restoring a bullish structure and risking a return to a bear phase. Holding above it would strengthen the buyers’ case and potentially open the path toward testing the $74,000–75,000 zone. Failure to maintain support, on the other hand, would validate more cautious forecasts.
The developing RSI divergence between Bitcoin and gold adds further intrigue. While not yet confirmed, its emergence increases the probability of a shift in market sentiment.
Despite firm U.S. trade rhetoric and ongoing global uncertainty, the crypto market is showing resilience. The next few days may prove decisive: either Bitcoin solidifies above a strategic level and confirms a long-term reversal, or the current rally turns out to be only a temporary pause within a more complex market phase.
All content provided on this website (https://wildinwest.com/) -including attachments, links, or referenced materials — is for informative and entertainment purposes only and should not be considered as financial advice. Third-party materials remain the property of their respective owners.