? How Much Bitcoin Costs and Used to Cost
Today, Bitcoin has become more than just a digital currency — it is a symbol of an entire financial era. Its emergence in 2009 launched a new system where money can exist outside the control of banks and governments. For some, it is “digital gold” and a store of value; for others, it is a speculative tool, comparable in risk to the most volatile assets. But the fact remains: Bitcoin is the main benchmark of the crypto market and an indicator of investors’ interest in the new economy.
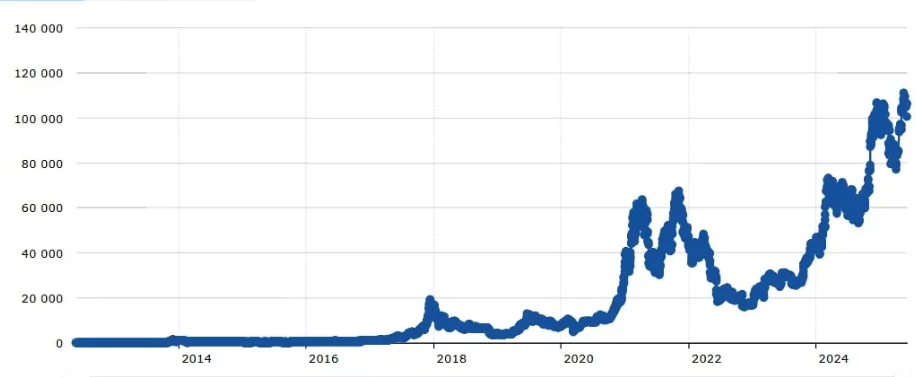
Throughout its history, BTC has soared and fallen, leaving dramatic price swings and notable stories. In the early days, the coin could be obtained almost for free, while by the mid-2020s the price of one Bitcoin is measured in tens of thousands of dollars. Its price chronology reflects not only the internal dynamics of the crypto market but also global economic trends, from crises to worldwide digitalization.
Bitcoin Exchange Rate Against the Dollar
A Brief History of Bitcoin Prices by Year:
2009: First Steps
In the first months of Bitcoin’s existence, there were no exchanges or official rates. Transactions were made directly between enthusiasts. One of the first trades was 5050 BTC for $5.02, setting the price at $0.00099 per coin.
2010: The Year of Pizza
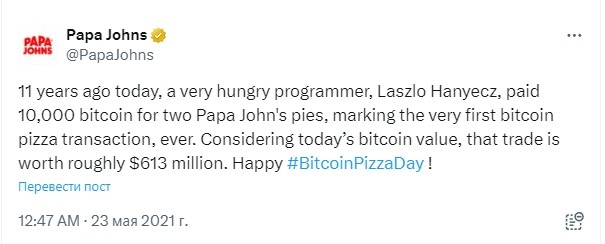
In spring 2010, the famous deal took place — two pizzas for 10,000 BTC. Today, this story is considered one of the brightest examples of Bitcoin’s rapid value growth.
“I want to report that I successfully exchanged 10,000 bitcoins for pizza,” said Hanetz to the bitcointalk.org community, one of whom congratulated him on the milestone.
The maximum price that year reached $0.40, and in July the first serious trading platform appeared — the Mt. Gox exchange.
2011: Bitcoin Hits $1
February 2011 was a turning point: the price reached $1 for the first time. In the summer, it jumped to $30 but fell to $5 by year-end, showing Bitcoin’s characteristic sharp and unpredictable fluctuations.
2012: Stability and the First Halving
During the year, Bitcoin traded between $0.50 and $13.45. In November, the first halving occurred, reducing the block reward from 50 to 25 BTC. The Bitcoin Foundation was established, supporting ecosystem growth.
2013: Growth and the First ATM
The first Bitcoin ATM appeared in Vancouver.

The price reached $1100 but then dropped after China’s central bank banned BTC operations.
2014: Mt. Gox Bankruptcy
The year started around $950 but fell sharply in spring due to the bankruptcy of Mt. Gox, which lost over 700,000 BTC. Despite the crisis, Microsoft and Overstock began accepting Bitcoin as payment.
2015: Decline and First Regulations
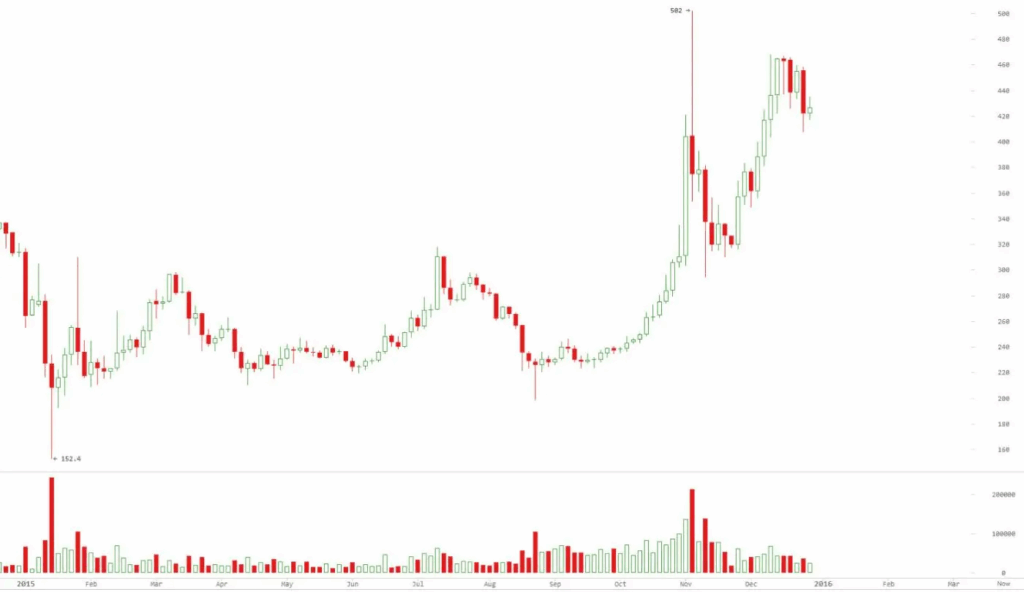
The price dropped to $150, which was a local minimum. Later, it rose to $460. In the USA, the first regulatory measures appeared — BitLicense.
2016: Steady Growth
Bitcoin strengthened and closed the year around $1,000. The network reached a hash rate of 1 exahash/second, an important indicator of its stability.
2017: Mass Interest
During the year, the price rose nearly to $20,000. This was driven by growing retail interest and the launch of futures on the Chicago Board Options Exchange.
2018: Bear Market
A bear market (when “bears push the market down” and most prefer to wait out the storm rather than take risks). After the peak, a decline followed. Bitcoin fell from $20,000 to $3,122 in December, and the year ended around $3,700.
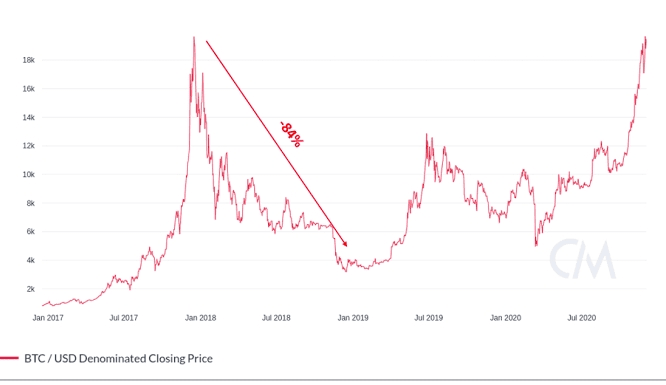
The price of Bitcoin fell from $20,000 to $3,122 in December, and the year ended at around $3,700.
2019: Partial Recovery
Bitcoin rose almost to $14,000 but finished the year below $7,200.
2020: Pandemic and New High
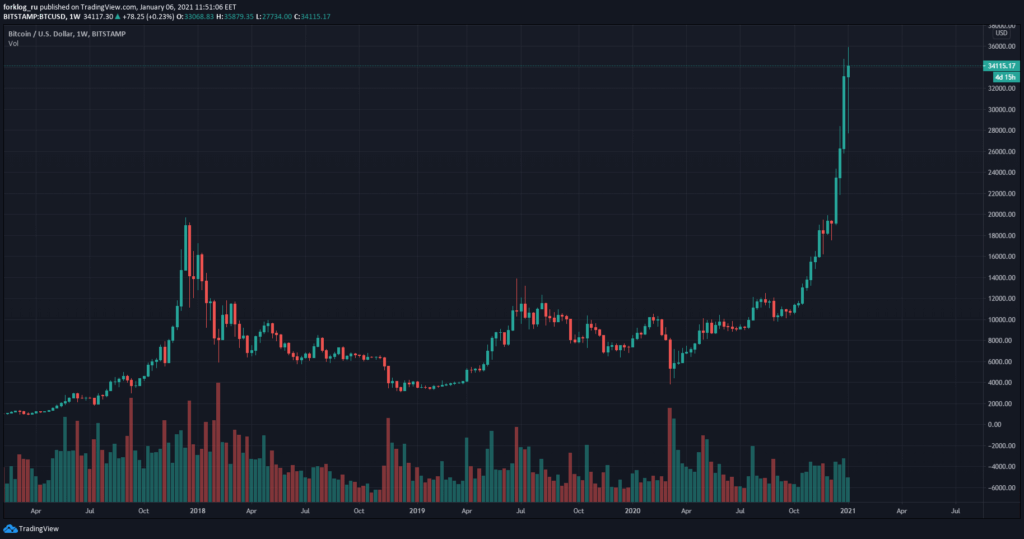
After the March crash to $3,850, Bitcoin recovered and closed the year at $29,000.
2021: Record Highs
The price reached $67,000 in November, but slightly fell by year-end. The year was marked by institutional interest and growing popularity of ETFs.
2022: Decline
Prices dropped to $18,000. Market instability and large players’ bankruptcies increased pressure on the cryptocurrency.
2023: Recovery
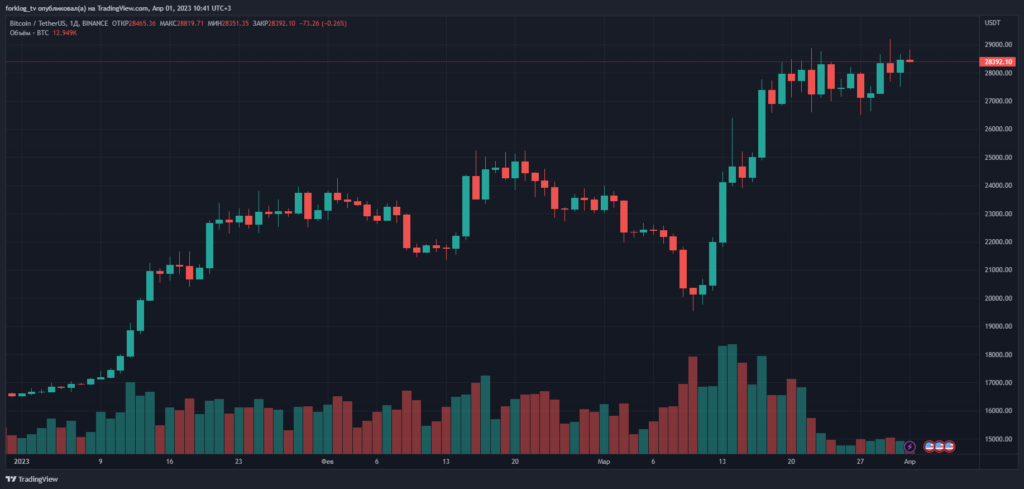
Despite regulatory pressure and bank bankruptcies, the price strengthened and rose to $44,500 by year-end.
2024: ETF Approval and New Records
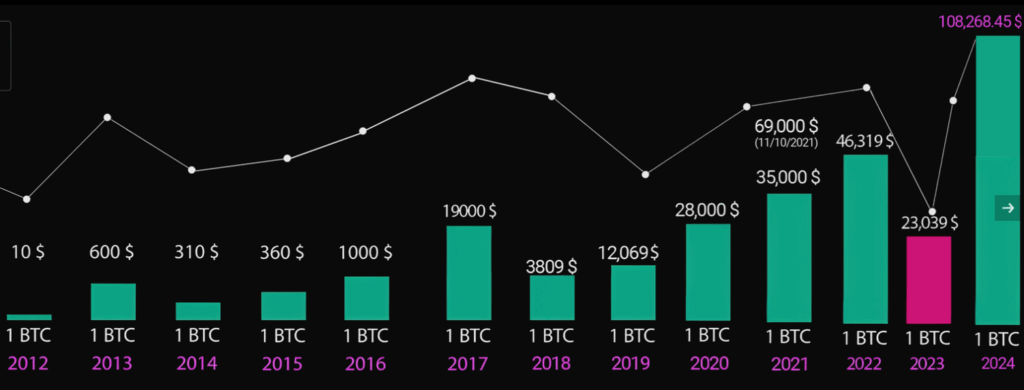
The launch of spot ETFs in the USA and the halving in April were the main growth drivers. In December, Bitcoin surpassed $100,000 for the first time.
2025: A New Stage
By January, the price reached $101,698, and in May it set a new all-time high, approaching $110,000. In the summer, the price remained around $105,000, indicating high capitalization and institutional interest.
Chronology of BTC Maximum and Minimum Prices
| Year | Maximum Price, $ | Minimum Price, $ |
|---|---|---|
| 2025 | 111 403 | 76 241 |
| 2024 | 106 595 | 39 968 |
| 2023 | 44 500 | 16 000 |
| 2022 | 47 835 | 18 490 |
| 2021 | 68 789 | 29 796 |
| 2020 | 29 096 | 3850 |
| 2019 | 13 880 | 3401 |
| 2018 | 18 343 | 3122 |
| 2017 | 19 000 | 784 |
| 2016 | 980 | 350 |
| 2015 | 460 | 150 |
| 2014 | 955 | 316 |
| 2013 | 1100 | 13 |
| 2012 | 13,45 | 0,50 |
| 2011 | 30 | 0,29 |
| 2010 | 0,40 | 0,00 |
| 2009 | 0,0041 | — |
? Conclusion
Bitcoin has experienced a remarkable history of dramatic highs and painful lows. Since its inception, it has become not only an investment asset but also a symbol of a new financial era. Its high volatility remains a challenge for investors, but the long-term trend proves that Bitcoin has become a fundamental part of the global market.
All content provided on this website (https://wildinwest.com/) -including attachments, links, or referenced materials — is for informative and entertainment purposes only and should not be considered as financial advice. Third-party materials remain the property of their respective owners.